Monitor supply chain sustainability, measure impact, with real-time data

From supply chain sustainability to nature projects and carbon offsets, automate monitoring and validate impact and sustainability claims with accurate, real-time data—backed by leading standards like Verra.

No items found.
Topographic 3D map of Pakistan showing mountainous terrain, forests, and plains.
Black filled circle on a white background.
The Market Problem

The hidden challenges in sustainability impact & validation

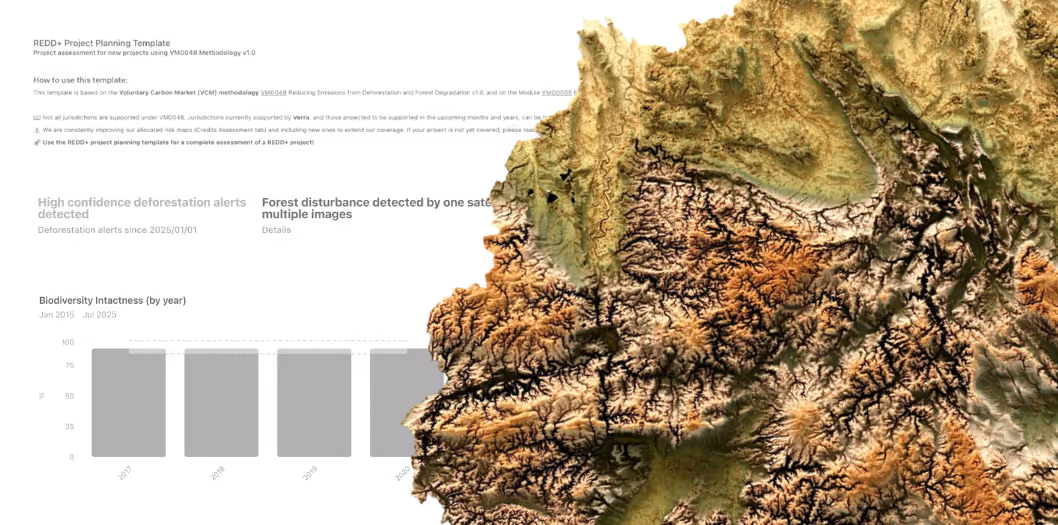
Validating sustainability impact is difficult when corporations face fragmented data, limited transparency, and complex processes across supply chains, restoration, conservation, and carbon initiatives.

Complex MRV and Reporting Requirements
Conservation and restoration projects require rigorous monitoring, reporting, and verification, but manual processes and inconsistent approaches often lead to unreliable data, increase the risk of errors, and reduce stakeholder confidence.
Fragmented Data Ecosystem
Land-use maps, satellite data, and biomass calculations live in separate spreadsheets and tools. This patchwork leads to gaps, version conflicts, and verification errors.
High dependency on GIS experts or consultants
Teams rely heavily on specialized GIS experts or external consultants to access, analyze, and interpret spatial data, slowing decision-making and increasing operational costs.
Lack of End-to-End Transparency
Project data lives in silos, making it difficult to trace results from field activities to reported outcomes across supply chains and nature projects.
Download our ARR Guide
Black filled circle on a white background.
Before and After

From Manual MRV to Automated Insights

Before Orbify
Manual field measurements & site visits
Data fragmented across spreadsheets
Limited traceability and unclear methodologies
High operational costs
Delayed insights from static reports
Low confidence in reported impact
After Orbify
Automated land cover change, biomass and biodiversity monitoring
Unified dashboard, all data in one place
Transparent, traceable data and methods
Lower costs, faster processes
Real-time insights for faster decisions
Credible, data-backed sustainability claims
Black filled circle on a white background.
Customer Stories

From Sustainability Teams to Investors Tailored Workflow

Black arrow pointing diagonally upward to the right inside a white circle.
Transmission Line Upgrade Project
The Challenge

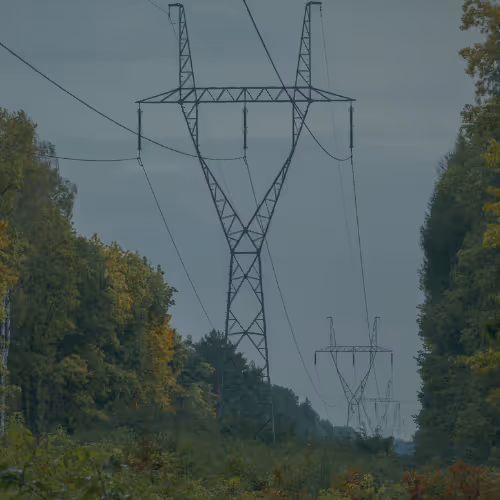
A power trader held a strategic position in North Texas, an area plagued by transmission constraints. While a critical 345-kV line upgrade began in March 2025 with an end-of-year target, the market lacked any public progress updates. Without visibility, the trader had no way of knowing when congestion would ease.

Orbify's Solution

Satellite imagery verified the upgrade was incomplete as of August 2025. Infrastructure showed work preparations and materials on the ground, but critical transmission components were months from operational.

The Outcome: The trader maintained and increased their position based on verified ground truth. They avoided premature exit from assuming completion, keeping their profitable congestion position as constraints persisted.

Black arrow pointing diagonally upward to the right inside a white circle.
Grid Risk Monitoring Pilot
The Challenge

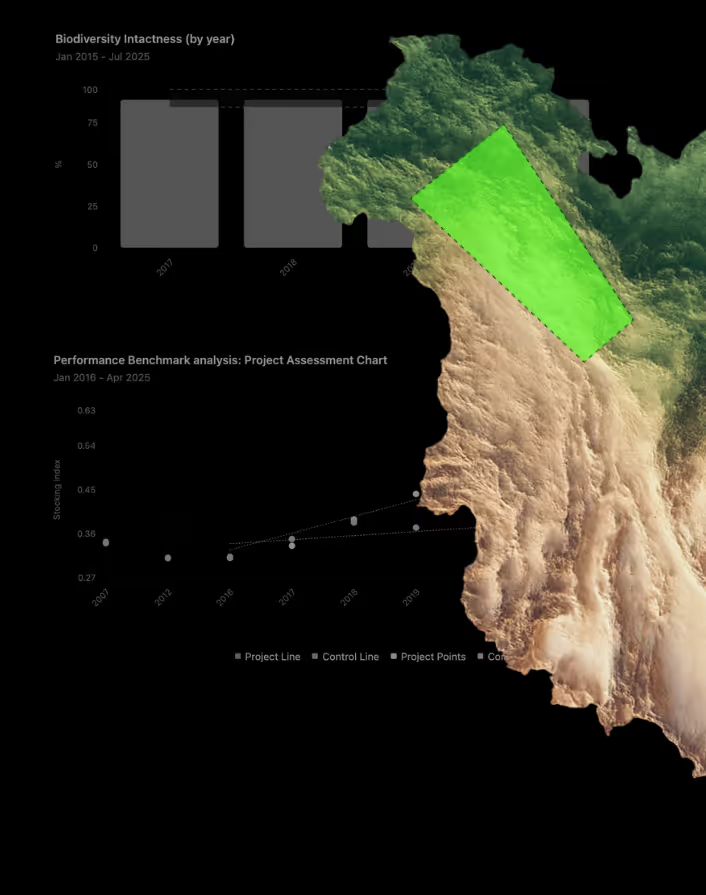
A South American Distribution Network operator needed to monitor vegetation and infrastructure risk along 87 pole-to-pole segments of a 10 km transmission corridor. Over a 4-week pilot, they required vegetation proximity monitoring and risk classification, individual tree counting, infrastructure detection and assessment of climate hazards and risks.

Orbify's Solution

Using high-resolution satellite imagery, Orbify analyzed the transmission corridor, identifying 6,834 individual trees, 12 structures that posed a threat to transmission line integrity, and categorized vegetation and tree fall risk for each segment. Our analysis allowed targeted remediation work to be undertaken, preventing the need for costly ground inspections. Our vegetation analytics - refined across 600M+ hectares for carbon and deforestation monitoring- now enable predictive grid maintenance at scale.

Black arrow pointing diagonally upward to the right inside a white circle.
Datacenter Site Capacity Validation
The Challenge

A real estate investor developing datacenter sites requested grid capacity studies. The feasibility study assumed a completed transmission upgrade unlocking 200 MW of available power. No public data confirmed actual project status.

Orbify's Solution

Using high-resolution satellite imagery, Orbify's analysis revealed the upgrade was still under construction. While the study assumed 200 MW of capacity, the actual available capacity was only 60 MW — a 70% discrepancy between projected and physical reality.

The Outcome: By identifying the 140 MW shortfall before capital deployment, the investor avoided a massive over-valuation. They corrected their site selection and financial models based on verified ground truth rather than outdated assumptions.

Black arrow pointing diagonally upward to the right inside a white circle.
Grid Risk Pilot in Chile
The Challenge

In a recent 4-week pilot with a regional DSO, we analyzed 9.78 km of transmission corridor. The platform counted 6,834 individual trees, identified 12 structures within 5 meters of the centerline, and classified vegetation risk across four proximity zones.

Validation accuracy reached 90% against field survey data.

Orbify's Solution

Our vegetation science comes from analyzing over 600 million hectares for carbon projects and deforestation monitoring. We've classified tree species, measured canopy heights, and tracked growth patterns across tropical forests, temperate zones, and arid landscapes — now applied to grid corridors.

Black arrow pointing diagonally upward to the right inside a white circle.
The Challenge
Orbify's Solution
Black filled circle on a white background.
Social Proofs

Proven with leading Sustainability Teams

See more use cases
Black filled circle on a white background.
How it works

From plot to impact in 3 steps

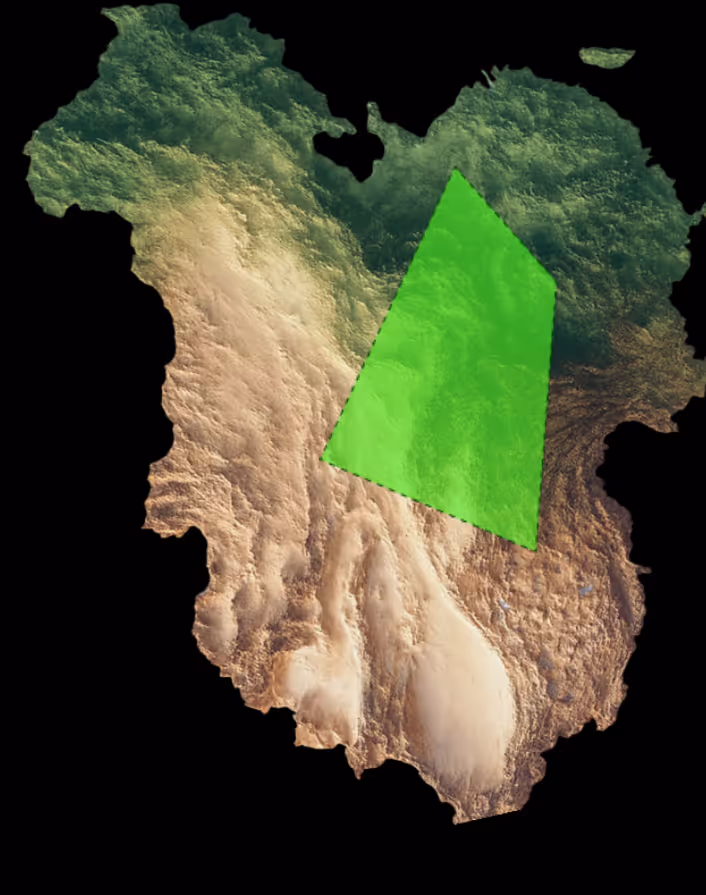
Upload your project area and parameters.


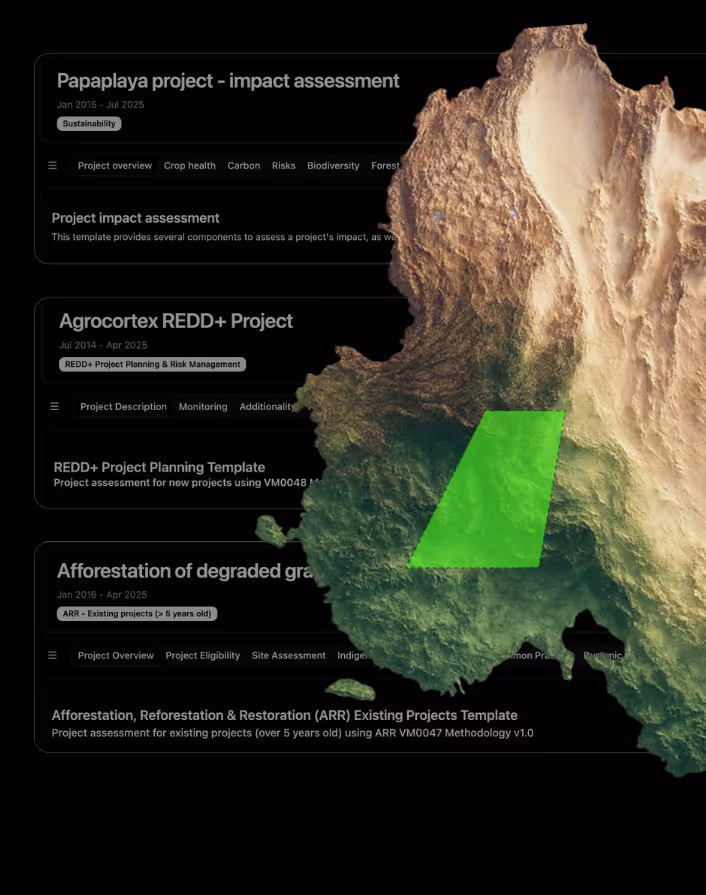
Select a template for your project type (supply chain, climate risks, ARR, REDD+, etc.), or start from scratch with full flexibility.

Access automated insights, impact metrics, and validation-ready reports powered by accurate, real-time data.

Book a Demo

Ready to validate your supply chain and sustainability projects?

From sustainability teams to compliance leaders, Orbify accelerates validation, reduces reporting effort, and costs and delivers audit-ready data to back credible sustainability and nature impact claims.